A tour of the dashboard
New to Re:InvestorHub? This page orients you on the main screen: what each item in the left navigation is for, and what the dashboard itself shows you.
The left navigation
Every page in Re:InvestorHub opens from the same sidebar on the left. From top to bottom:
| Item | What it's for |
|---|---|
| Dashboard | Your home screen: a snapshot of your deals, portfolio, projects and tasks. |
| AI Coach | Chat with Re:InvestorHub's AI coaches. Lenny the Lender covers financing, Sid the Project Manager covers renovation and contractors, and Annie the Agent covers market analysis and finding deals. |
| Deal Search | Search for properties and see the prospects you've saved. |
| Deal Analyzer | Run the numbers on a specific deal, using a strategy like Fix & Flip, BRRRR, Buy & Hold, Short Term Rental, or Wholesale. |
| Deal Pipeline | Track deals you're working, from Analyzing through Closed. |
| Portfolio | The properties you own: equity, cash flow, occupancy and ROI. |
| Projects | Renovation projects: budgets, schedule and change orders. |
| Documents | Files attached to your deals and properties, organized in folders. |
| Tasks | To-dos tied to your deals and projects. |
Further down, under Tools & Resources:
| Item | What it's for |
|---|---|
| Learn | Videos, courses and other resources on evaluating and running deals. |
| Calculators | Standalone calculators for cash flow, ROI, mortgage payments, cap rate, BRRRR and more, plus a shortcut back to the Deal Analyzer. |
| Reports | Generate and export reports on your portfolio, deals and projects. Which reports you can generate depends on your plan. |
| Settings | Your profile, organization, notifications, subscription, security, and team. |
Note
Team management lives under Settings → Team. How many people you can invite depends on your plan: Silver is a single-user plan, and Gold supports up to 5 users.
The dashboard itself
When you sign in, you land on the dashboard.
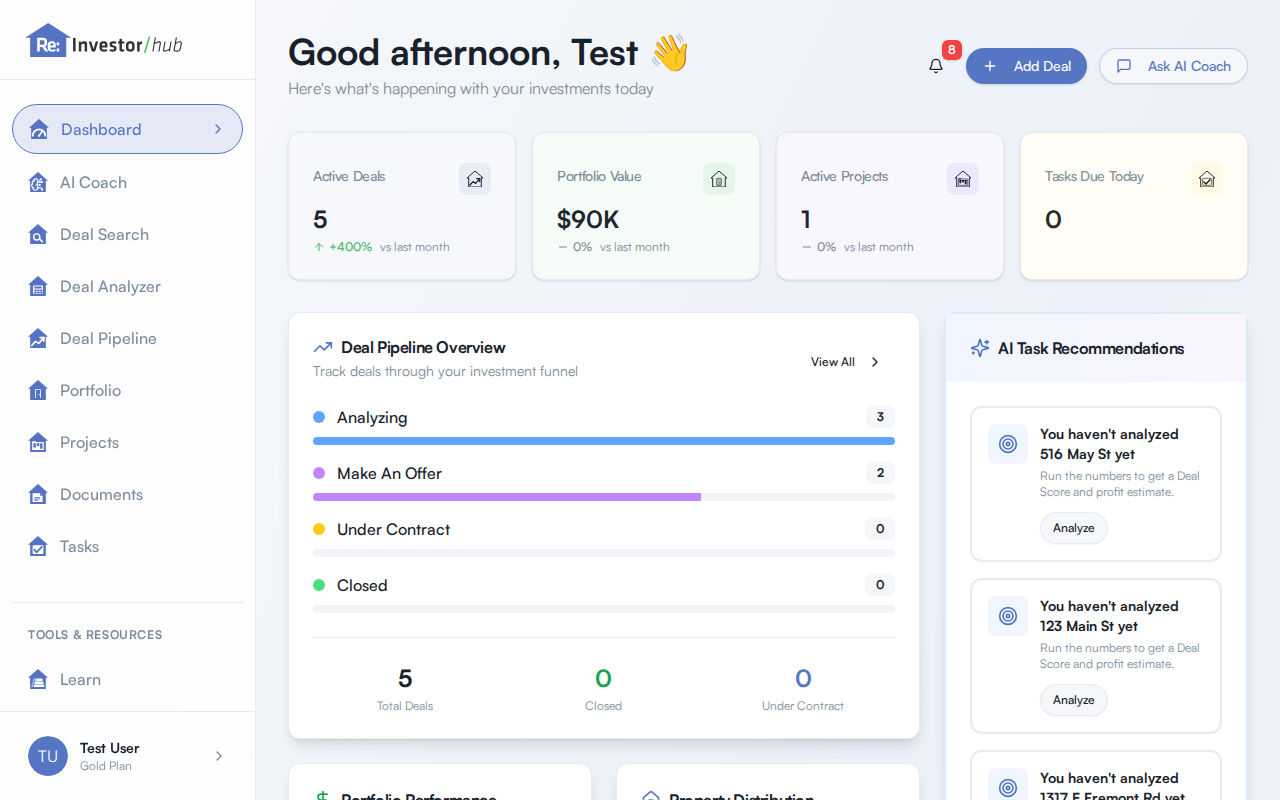
At the top, a header greets you by name and tells you what's happening with your investments today, next to Add Deal and Ask AI Coach shortcuts. A bell icon shows your notification count.
Below that, four cards summarize your account at a glance: Active Deals, Portfolio Value, Active Projects, and Tasks Due Today. Active Deals, Portfolio Value, and Active Projects also show a trend arrow and a percentage change versus last month. Tasks Due Today shows the count on its own.
The Deal Pipeline Overview card breaks your deals down by stage (Analyzing, Make An Offer, Under Contract, Closed) with a count for each, plus totals for deals overall, closed deals, and deals under contract. View All takes you to the full Deal Pipeline page.
Next to it, AI Task Recommendations suggests what to do next, such as prompting you to analyze a deal you haven't run the numbers on yet, or flagging a deal where key inputs are still missing. This is also where you'll see Deal Score come up: a 0.0 to 10.0 score Re:InvestorHub gives a deal once you've analyzed it, with higher being stronger. You'll see it again on deal cards in the Deal Pipeline and inside the Deal Analyzer.
Further down, Portfolio Performance and Property Distribution chart your cash flow and the property types in your portfolio, and Recent Activity lists what's changed lately: deals updated, properties added, project progress, and completed tasks.
A Getting Started with Re:InvestorHub banner at the bottom links to a short guided tour of the platform if you want a walkthrough beyond this page.